

Guide to online measurements
AIR
In Hungary, the following legislation applies to air quality:
Decree 4/2002 (X. 7.) KvVM on the designation of air pollution agglomerations and zones.
Decree 306/2010 (XII. 23.) Korm. on air protection.
Decree 4/2011 (I. 14.) VM on air pollution level limits and emission limit values for stationary air pollution point sources.
Decree No 6/2011 (I. 14.) VM on the rules for the investigation, monitoring and assessment of air pollution levels and emissions from stationary sources.
The health limit values are set by Decree 4/2011 (I.14) VM, in accordance with EU Directives 2008/50/EC and 2004/106 EC (and its amendment, EU 2015/1480).
The health limit values and target values for air pollution levels are set out in Annex 1 to VM Regulation 4/2011 (14.I.2011):
The limit values, target values, long-term objectives, information and alert thresholds apply to air with a temperature of 293 K and a pressure of 101.3 kPa. The limit values and target values for particulate matter (PM10 and PM2,5) and pollutants in particulate matter refer to the ambient conditions at the time of measurement.
| Pollutants | Limits (µg/m³) | Target (µg/m³) | ||
|---|---|---|---|---|
| hours | 24 hours | annual | annual | |
| O3 | - | *120 | - | - |
| NO2 | 100 | 85 | 40 | - |
| SO2 | 250 | 125 | 50 | - |
| CO | 10 000 | *5 000 | 3 000 | - |
| PM₂.₅ | - | - | **25 | - |
| PM₁₀ | - | 50*** | 40 | - |
| 3,4-Benzo(a)pyrene | - | 0,001 | 0,0012 | 0,001 |
| Nickel | - | - | 0,025 | 0,02 |
| Arsenic | - | - | 0,01 | 0,006 |
| Cadmium | - | - | 0,005 | 0,005 |
| Chromium | - | - | 0,05 | - |
| Mercury | - | - | 1 | - |
| Lead | - | - | 0,3 | - |
*maximum of 8-hour daily moving average concentrations
**From 1 January 2020, the indicative limit value for PM2,5 is 20 μg/m3 according to Annex 1, point 1.2.4. of Decree 4/2011 (14.I.) VM.
***not to be exceeded more than 35 times in any calendar year
Design guidelines for certain air pollutants:
| Pollutants | design reference values (µg/m3) | |
|---|---|---|
| hours | 24 hours | |
| nitrogen oxides | 200 | 150 |
| toluol | 600 | 200 |
| ethylbenzene | 20 | 20 |
| xylol | 200 | 60 |
| cobalt | - | 0,1 |
| manganese | - | 1 |
| copper | - | 1 |
| acetone | 350 | 350 |
| NMP | 100 | 50 |
Information and alert thresholds:
| Pollutants | Information threshold (μg/m3) | Alarm threshold (μg/m3) |
|---|---|---|
| SO2 | 400* | 500 exceeded 400 for three consecutive hours or more than 72 hours |
| NO2 | 350* | 400 exceeded 350 for three consecutive hours or more than 72 hours |
| CO | 20000* | 30000 exceeded 20000 for three consecutive hours or more than 72 hours |
| PM₁₀ | 75** | 100** |
| O3 | 180* | 240 exceeded 180 for three consecutive hours or more than 72 hours |
*for three consecutive hours
** no improvement for two consecutive days and no improvement for the next day according to the weather forecast
Air pollution index
The Air Quality Index (AQI) is a numerical indicator of the air quality at a particular place and time, and how it may affect health. As the level of air pollution increases, the AQI rises and with it the health risk.
Here we use the Air Quality Index (AQI), which was introduced in the EU in 2017 and is still in use. Air quality is classified into 6 categories based on the main pollutants: excellent, good, fair, polluted, highly polluted and extremely polluted.
The index takes into account the mass concentration values of the following pollutants:
- Carbon monoxide (CO)
- Nitrogen dioxide (NO2);
- Ozone (O3);
- Aerosol particles, sub 10 micron fraction (PM10);
- Aerosol particles, sub 2.5 micron fraction (PM2,5);
- Sulphur dioxide (SO2);
The ranges have been defined taking into account the risks of short-term effects of PM2,5, O3 and NO2.
| Excellent | Good | Moderate | Polluted | Very Polluted | Extremely Polluted | |
|---|---|---|---|---|---|---|
| CO | 0-4000 | 4000-8000 | 8000-10000 | 10000-20000 | 20000-30000 | 30000-50000 |
| PM₂.₅ | 0-10 | 10-20 | 20-25 | 25-50 | 50-75 | 75-800 |
| PM₁₀ | 0-20 | 20-40 | 40-50 | 50-100 | 100-150 | 150-1200 |
| NO₂ | 0-40 | 40-90 | 90-120 | 120-230 | 230-340 | 340-1000 |
| O₃ | 0-50 | 50-100 | 100-130 | 130-240 | 240-380 | 380-800 |
| SO₂ | 0-100 | 100-200 | 200-350 | 350-500 | 500-750 | 750-1250 |
Health proposals
The domains for the index are complemented by proposals that include recommendations on health status. These recommendations provide guidelines for both healthy people and vulnerable groups. Children, the elderly and people with respiratory or cardiovascular problems are usually the first sensitive groups to be affected by poor air quality.
| Air quality index | General population | Sensitive groups |
|---|---|---|
| Excellent | Air quality is good. Enjoy the usual outdoor activities. | Air quality is good. Enjoy the usual outdoor activities. |
| Good | Enjoy the usual outdoor activities. | Enjoy the usual outdoor activities. |
| Moderate | Enjoy the usual outdoor activities. | Consider reducing intense outdoor activities if you experience symptoms. |
| Polluted | Consider reducing intense outdoor activities if you experience symptoms such as sore eyes, coughing or sore throat. | Consider reducing physical activity, especially outdoors, especially if you experience symptoms. |
| Heavily polluted | Consider reducing intense outdoor activities if you experience symptoms such as sore eyes, coughing or sore throat. | Reduce physical activity, especially outdoors, especially if you experience symptoms. |
| Extremely polluted | Reduce physical activity outdoors. | Avoid outdoor physical activities. |
Comparing and installing tools
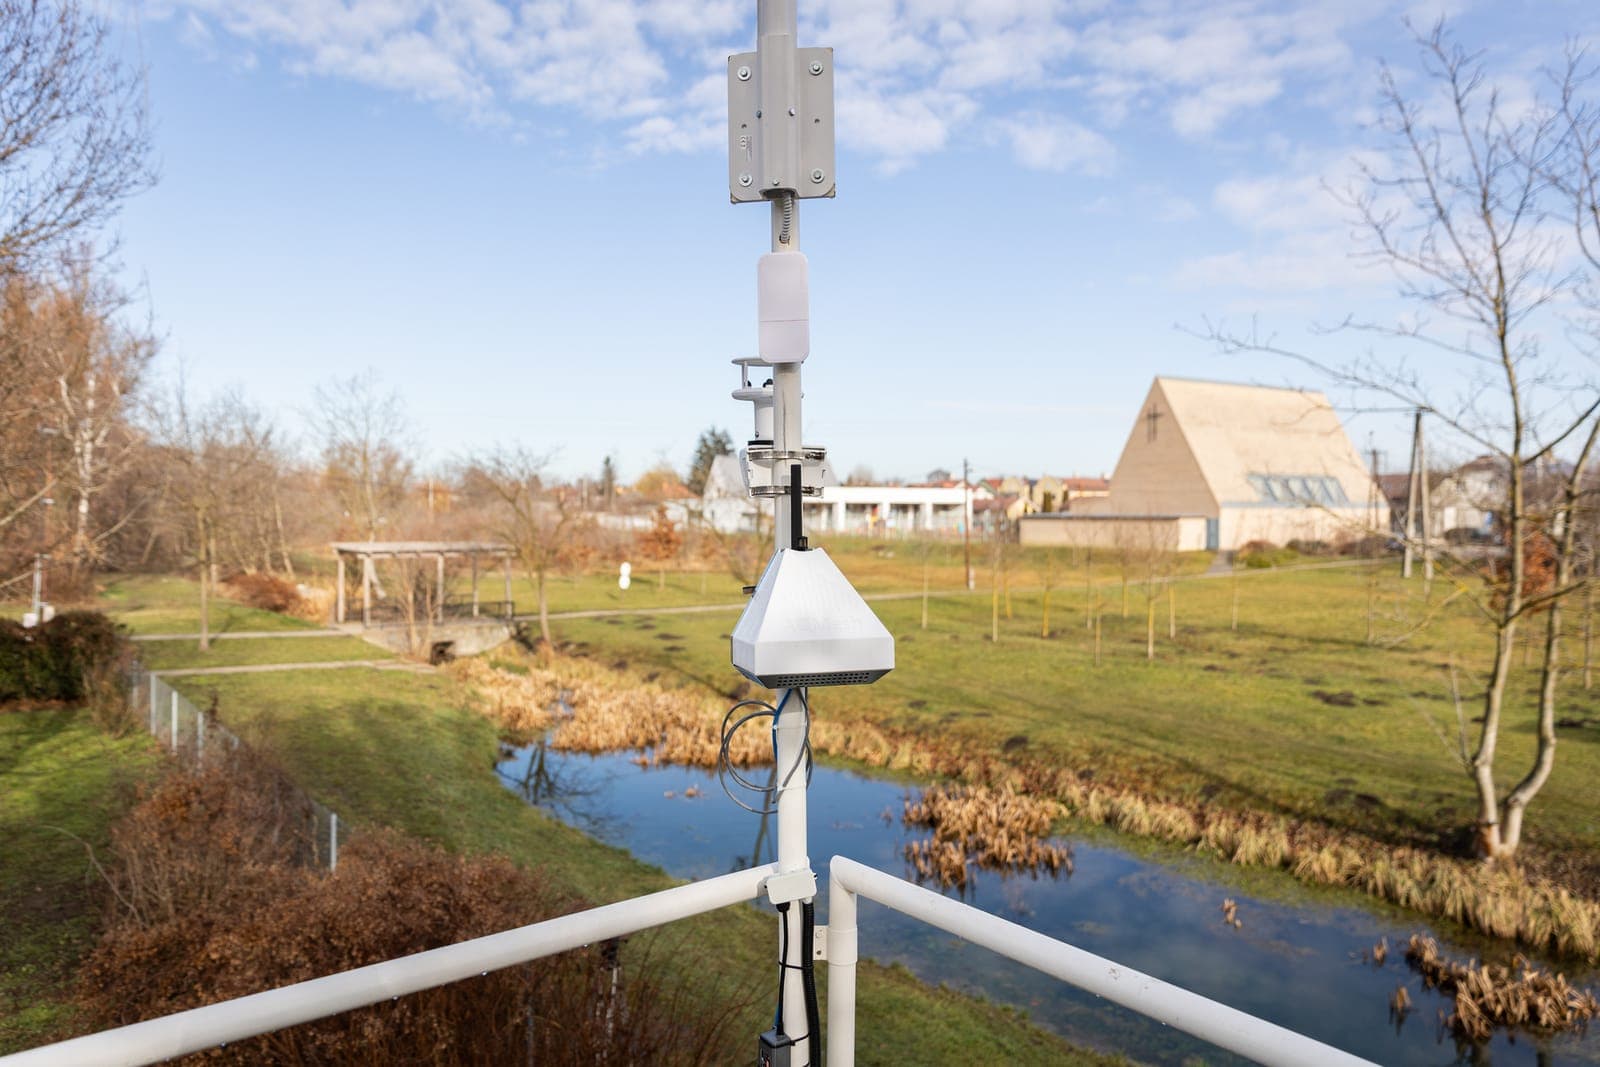
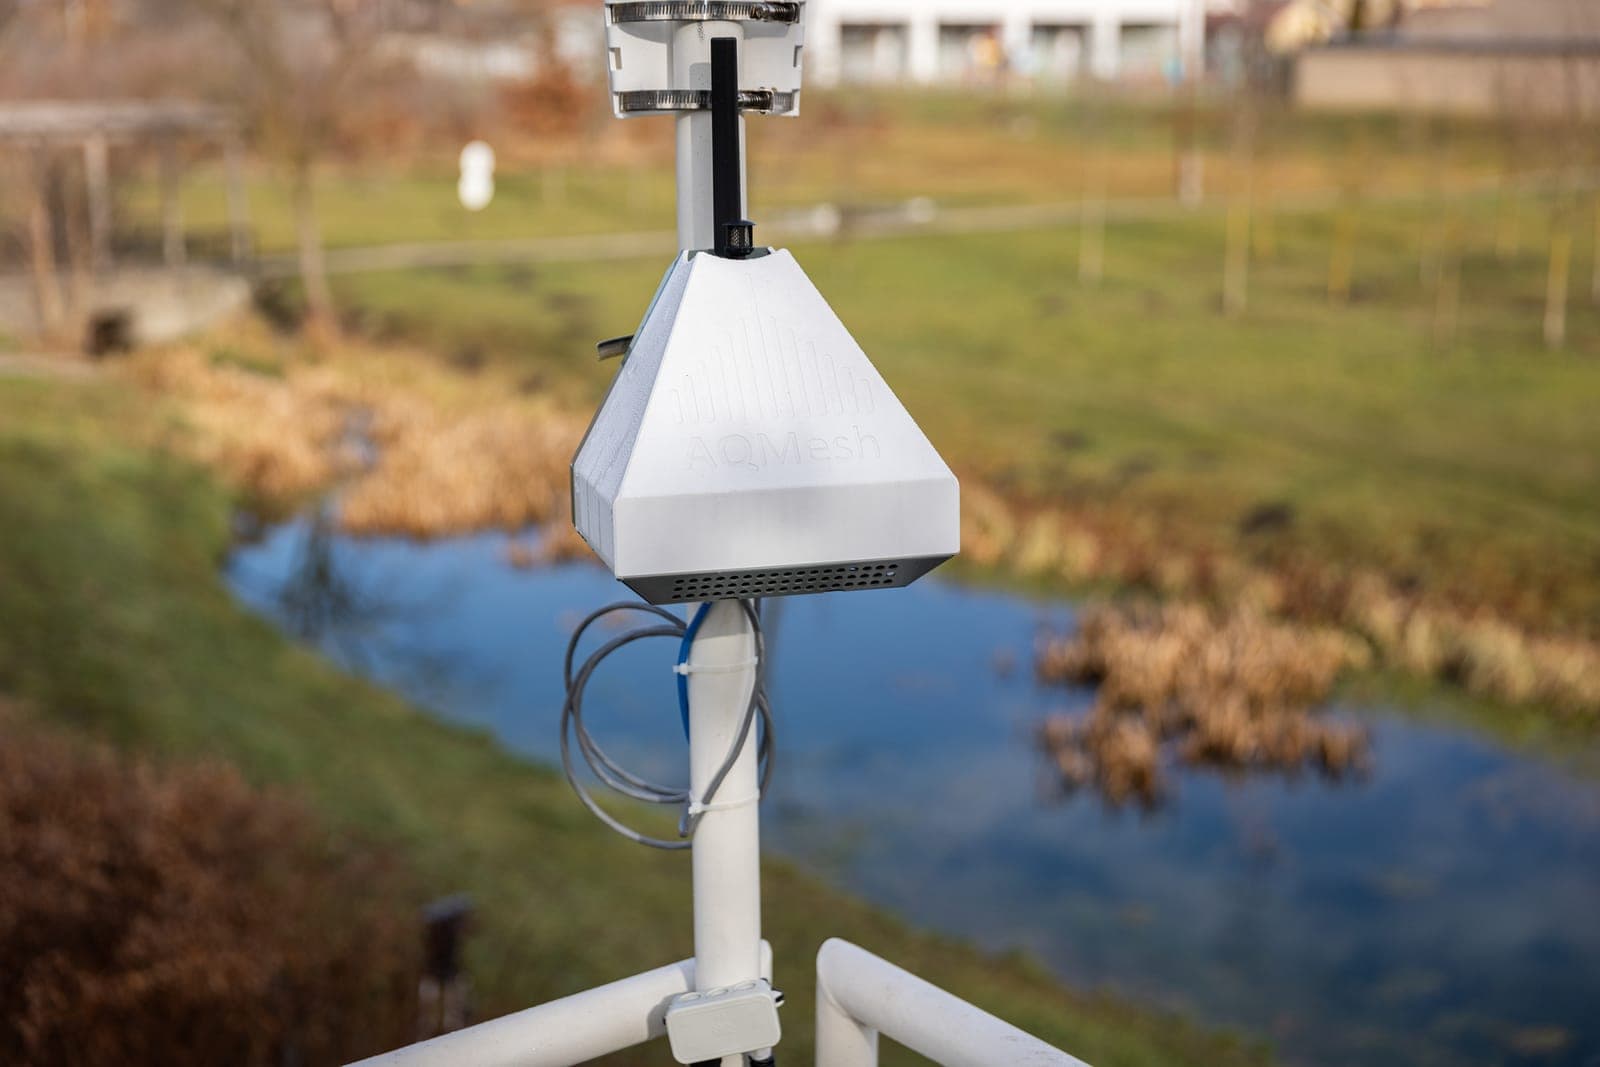
Prior to installation, all AQMesh sensors were deployed by the experts at the measurement station of the HUN-REN Nuclear Research Institute for a period of 2 months. This allowed them to check how the sensors performed against the reference points and against each other. This comparison ensured the determination of instrument-specific correction factors. Following the benchmarking, the experts installed the devices at the 16 complex measuring stations of the Green Sentinel.
WATER
Surface water
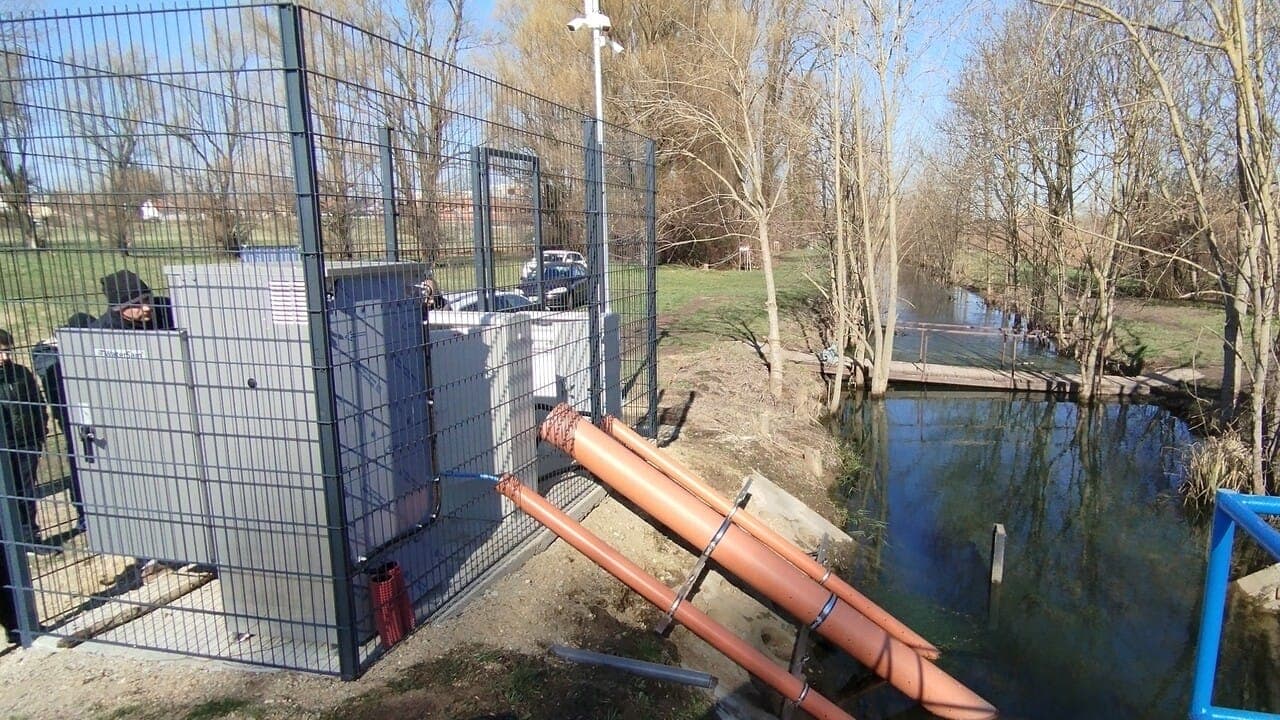
The Tócó Canal runs north-south through the city. Two sites have been selected by the experts, the northern site to serve as a reference point, while the southern site is a monitoring point under the Economic Belt, to check water quality leaving the administrative boundary of the city. Thus, the monitoring of changes in water quality is carried out in accordance with professional criteria.
The 2 surface water measuring stations are responsible for the continuous monitoring of water quality, the 15-minute measurement of water quality and the storage and transmission of the measured data. It measures dissolved oxygen, pH, redox potential (ORP), specific electrical conductivity, turbidity, chlorophyll, fluorescent dissolved organic matter (fDOM), temperature, water flow and average velocity. The automatic water sampling system operates on the vacuum sampling principle, with adjustable sampling and vessel changeover frequency. Samples taken by the instrument are tempered to 3°C by the built-in cooling and heating unit and stored according to the purpose of the test, e.g. water samples taken for volatile organic analysis are stored without evaporation. Water samples taken with the automatic water sampler are tested after transport to the laboratory.
Surface water testing is carried out on a quarterly basis and a summary report of the test results will be available on the website.
The Tócó is a lowland small watercourse, therefore the water quality limit values in Annex 2 of Decree 10/2010 (VIII.18.) VM No.2 are relevant, and the components measured online by surface water measuring stations are used as alarm thresholds:
- conductivity: 1000(µS/cm)
- dissolved oxygen: 6 mg/l
- pH: 6.4 and 9.1 (threshold: 6.5-9)
- water temperature: not controlled (because it varies, e.g. depending on the season, rainfall)
- redox potential: not controlled
- chlorophyll: not regulated for surface water, only for standing water
- turbidity: not regulated, only for standing water
Groundwater
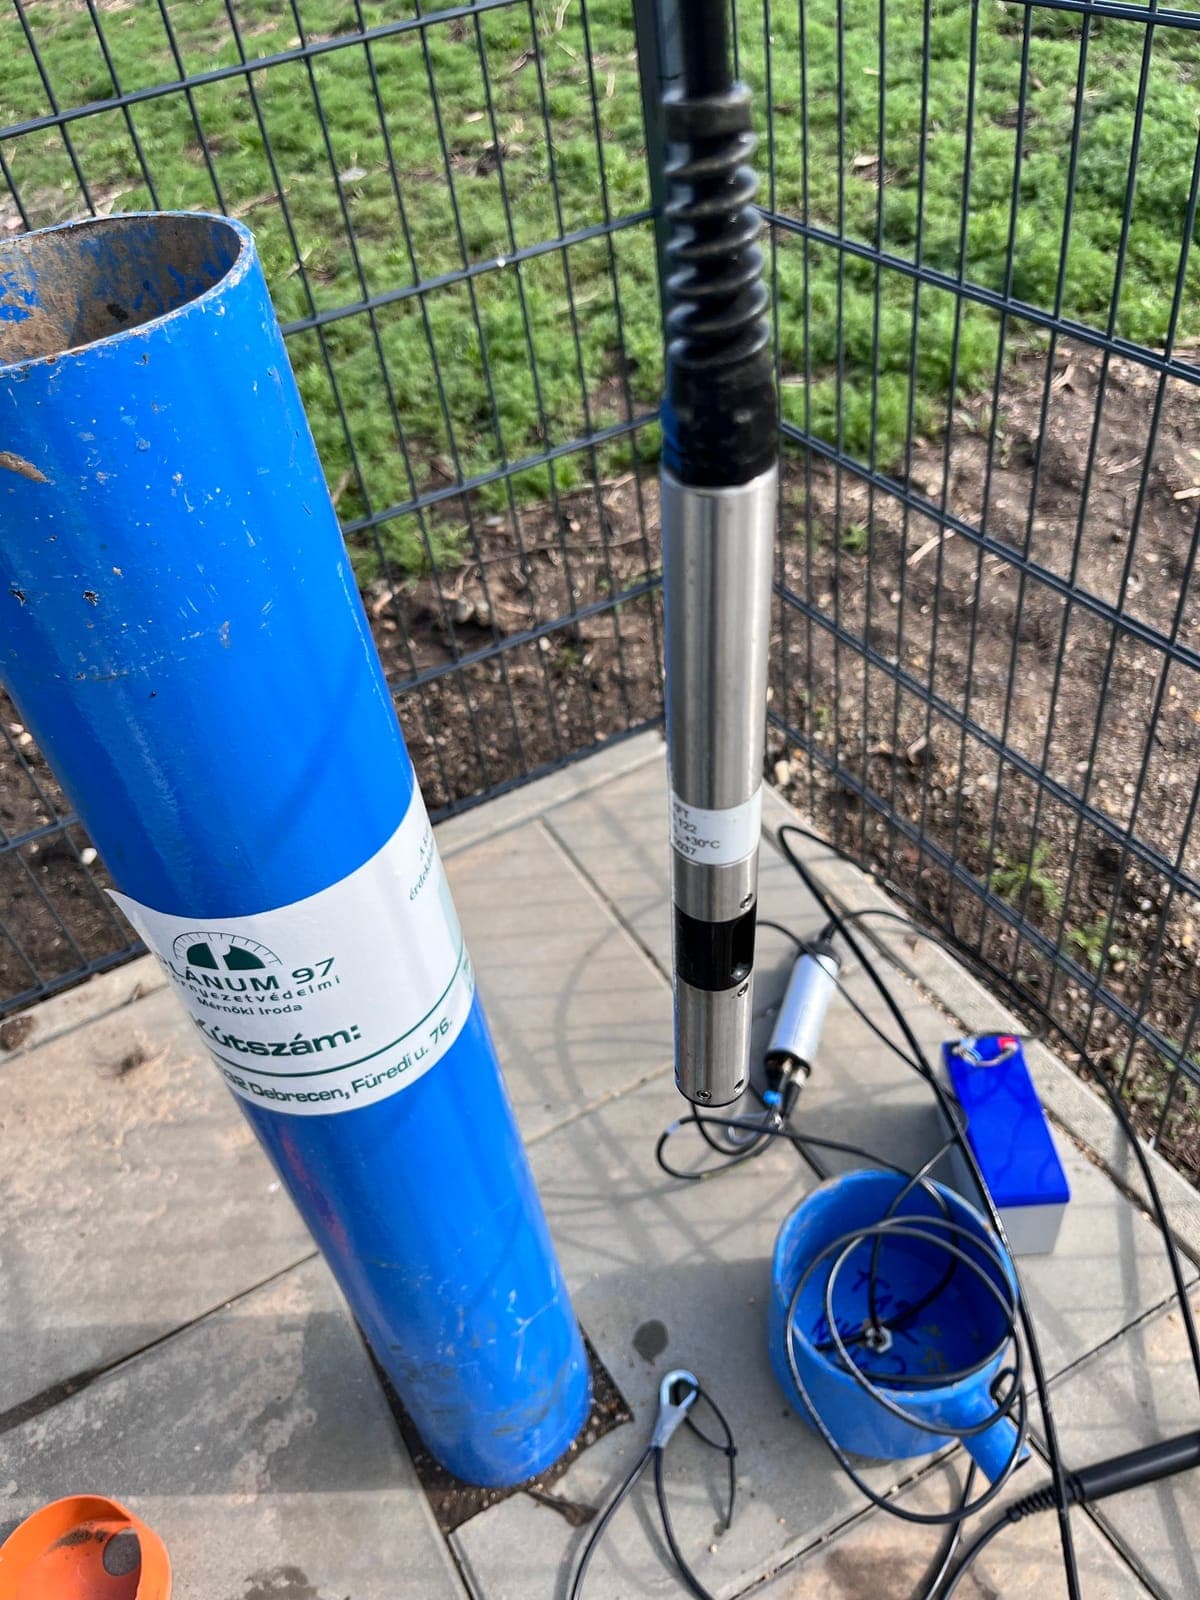
We have installed one shallow monitoring well for each of the 16 complex monitoring stations, which have a water operating licence. Pressure-sensing well water level and water temperature recording probes were installed in the wells to continuously measure water temperature, water level and conductivity. The measured data are displayed on the website.
Groundwater testing will be carried out at six-monthly intervals in accordance with the technical specifications and the water operating licence, and a summary report of the test results will be available on the website.
Surface water and groundwater sampling and testing will be carried out by Debreceni Vízmű Zrt. NAH-1-1179/2023.
According to the Joint Decree 6/2009 (IV. 14.) of the Ministry of Agriculture, Forestry, Environment and Water Management on the limit values required for the protection of the geological environment and groundwater against pollution and on the measurement of pollution, the following limit values apply to online measurements:
- conductivity: 2500 µS/cm
- water temperature: not regulated
- water level: not regulated
NOISE
Our aim is to provide the people of Debrecen with continuous information on the environmental noise exposure of the city and its population, so we have purchased seven integrated noise measuring instruments of the first accuracy class, six of which are permanently installed at the complex measuring stations. The seventh instrument is a mobile unit for ad hoc measurements. A portable calibrator is essential to ensure a stable and continuous measurement. Calibration and evaluation of the results is carried out by a noise and vibration expert.
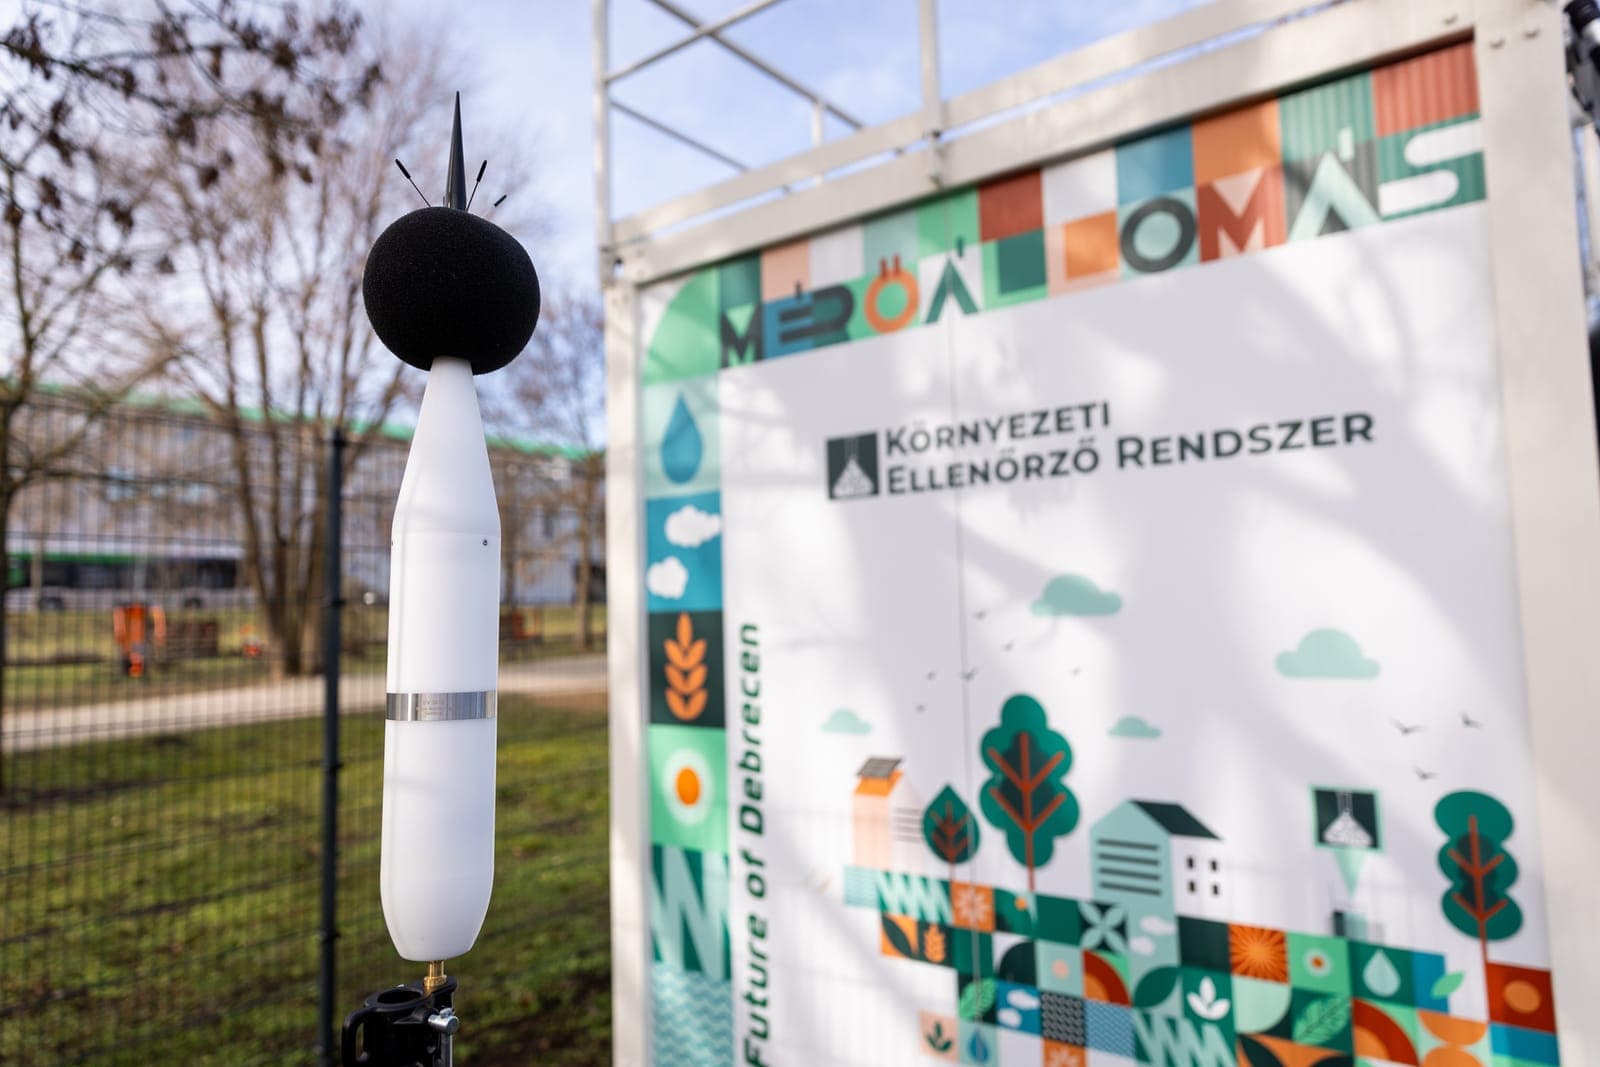
The instruments are able to work with several weighting filters (A, B, C, Z, LF) simultaneously, of which the most notable is the weighting filter that adjusts the measured values to the characteristics of human hearing, i.e. it provides information on what people actually hear from the different frequencies and intensities of noise at the measurement points. The noise monitoring stations are capable of recording a number of parameters simultaneously, complemented by a terc-octave-band analysis module for frequency analysis of ambient noise. This also allows the effects of different sources to be isolated, depending on the specificities of the measurement site.
The instruments installed at the measuring stations already have a certification issued by the Meteorological and Technical Surveillance Department of the Budapest Metropolitan Government Office. This will provide conclusive results in official and legal proceedings.
Noise limits
The EEA (European Environment Agency) defines long-term unhealthy traffic noise levels as 55 dB or higher for Lden and 50 dB or higher for Léjjel. Debrecen Municipal Decree 47/2020 (XII. 28.) of the General Assembly of the Municipality of Debrecen on the Local Building Code of the City of Debrecen, which determines the classification of the city's zones.
There is a close correlation between zoning and noise limits in a city, as different functional areas have different noise exposure requirements. Zoning determines the use to which an area can be put (e.g. residential, industrial, mixed, etc.) and also the maximum noise level allowed there. Noise regulations generally set different limits according to the time of day (day and night) and assign them to different types of areas (e.g. recreational, residential, commercial). The link between zoning and noise limits is that the function of the area determines the permissible noise levels and urban planning must take these into account to ensure a sustainable and liveable environment.
The environmental noise and vibration limits are laid down in Joint Decree 27/2008 (XII.3.) of the Ministry of Transport, Building and Urban Affairs.
Noise exposure limits for noise from business and leisure facilities in areas to be protected against noise:
| Area to be protected from noise | Limit value (LTH) for the LAM assessment level (dB) daytime 06-22 h | Limit value (LTH) for the LAM judgement level (dB) at 22-06 h at night |
|---|---|---|
| Recreation areas, special areas including health areas | 45 | 35 |
| Residential areas (small urban, suburban, rural, built-up areas), special areas (educational establishments, cemeteries, green areas) | 50 | 40 |
| Residential area (built-up area), mixed area | 55 | 45 |
| Economic area | 60 | 50 |